The paradox
When DeepMind released AlphaFold database in 2021, it felt like magic. Predicting 3D protein structures directly from amino acid sequences was one of the biggest scientific breakthroughs of our generation. Suddenly, over 200 million 3D protein models were accessible to anyone with an internet connection.
I have been fascinated by AlphaFold for years. But every time I tried to dive into the AlphaFold Database or standard web viewers, I ran into a wall.
The tools built to view these predictions are made by structural biologists for structural biologists. They are packed with complex panels, clinical dark gray backgrounds, unlabelled buttons, and obscure jargon. If you want to know how a protein actually works or why a specific mutation causes a human disease, you have to cross-reference multiple databases, research papers, and sequence alignments yourself.
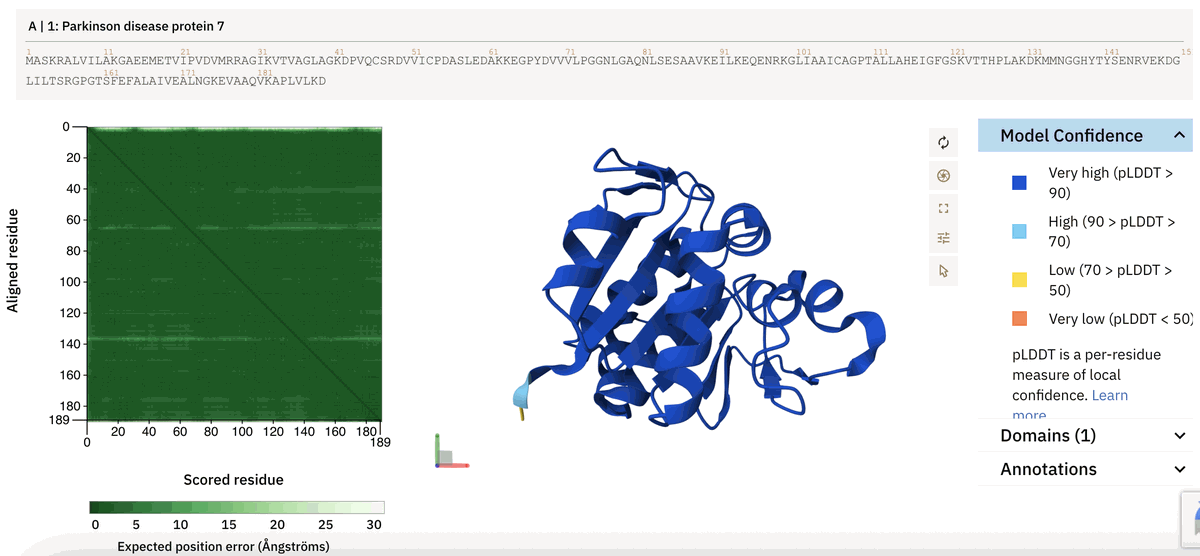
Screenshot of AlphaFold DB entry AF-Q99497-F1
What if exploring a protein structure felt as engaging and intuitive as reading an interactive digital essay? With the help of Antigravity, a Gemini agent and Claude agent, I set out to design and build a better way to explore AlphaFold structures.
Cellular rust detector DJ-1
To test this vision, I wanted a protein with a clear biological story: small enough to comprehend easily, but clinically important.
I chose DJ-1 (encoded by the PARK7 gene).
DJ-1 is a 189-amino-acid human protein that acts as an oxidative-stress sensor. When metabolic byproducts like reactive oxygen species build up in your cells, DJ-1 neutralizes them before they can damage DNA or other proteins. If DJ-1 suffers a loss-of-function mutation, neurons in the brain are left vulnerable. This loss is a direct cause of an inherited, early-onset form of Parkinson's disease that can manifest before age 40.
DJ-1 is essentially the cell's rust detector.
The vision
Instead of presenting structural data inside a cluttered desktop-like interface, our vision was to treat structural biology as an interactive digital essay. We designed DJ-1 Explorer, a single-page web app where every visual component—from sequence letters to chemical formulas—connects directly to the live 3D fold.
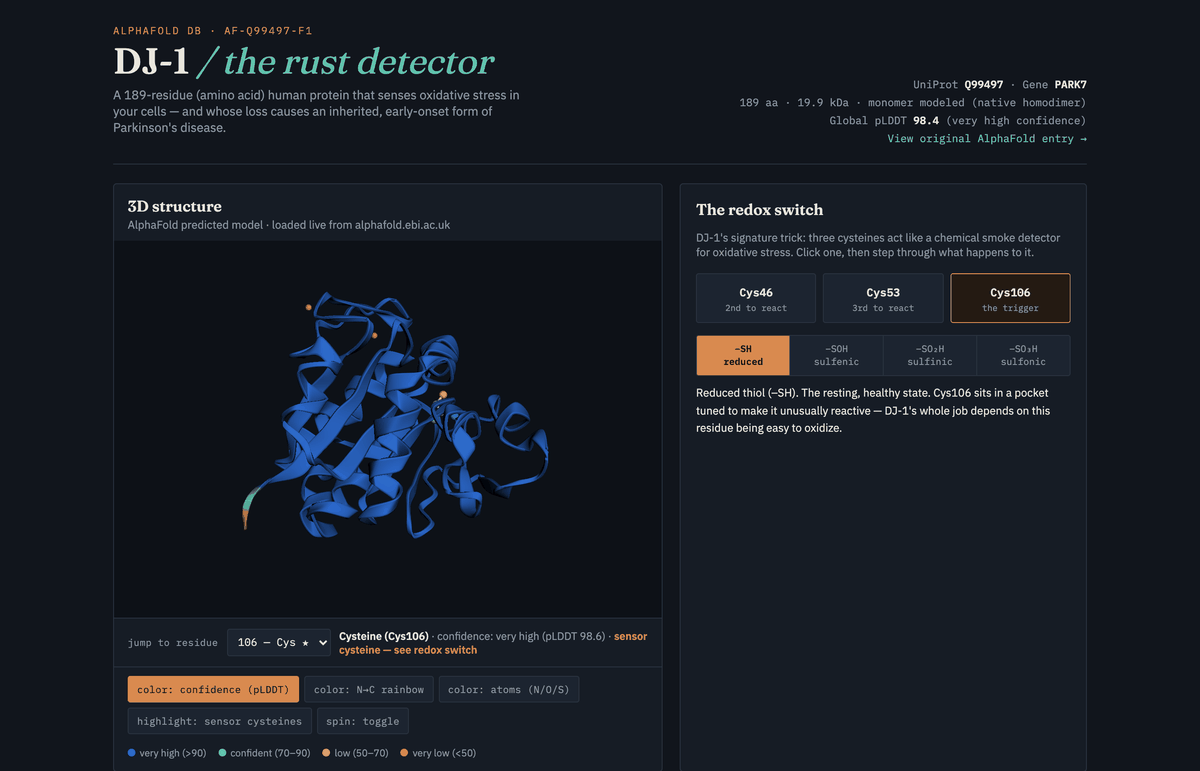
The interface brings together six core components in a unified narrative layout:
- Editorial header: Establishes biological context immediately, displaying
the protein's function ("the rust detector"), gene symbol (
PARK7), UniProt ID (Q99497), molecular mass (19.9 kDa), and global prediction confidence (pLDDT 98.4). - 3D canvas: A responsive 3Dmol.js viewer that renders the live AlphaFold structure with customizable display modes (pLDDT confidence, N→C rainbow, atomic elements, sensor cysteine highlights, and spin controls).
- The redox switch: An interactive chemical walkthrough that lets users
step through four oxidation states (
-SH→-SOH→-SO2H→-SO3H) for each of the three sensor cysteines, explaining how DJ-1 detects cellular stress. - Sequence map: A complete 189-residue interactive bar color-coded by pLDDT confidence, supporting bidirectional click-to-zoom sync and full keyboard navigation.
- Side chain spotlight: A chemistry panel featuring hand-crafted SVG skeletal diagrams (for Arg and Cys) with plain-language atomic keys.
- Quick facts & disease summary: A contextual footer card explaining DJ-1's flavodoxin-like fold, its homodimer assembly, and why loss-of-function mutations lead to early-onset Parkinson's disease.
The 3D molecular structure
Rendering a live, responsive 3D molecular structure inside a web browser without sacrificing performance or aesthetics required several technical innovations.
Stream live coordinates
Rather than bundling large, pre-rendered 3D assets or static images, the viewer
fetches the official AF-Q99497-F1 atomic coordinate file directly from the
AlphaFold Database at page load. This guarantees users are inspecting real,
unmodified structural data.
Parse true pLDDT confidence scores
AlphaFold outputs a per-residue prediction confidence score known as pLDDT (ranging from 0 to 100), stored inside the coordinate file's B-factor column. Our custom parser extracts these values and maps them into four clear, discrete confidence bands:
- Very high (>90): Blue highlights where predicted atomic positions are highly reliable.
- Confident (70–90): Teal covering well-defined secondary structures.
- Low (50–70): Muted amber warning where backbone predictions are uncertain.
- Very low (<50): Bright orange marking disordered or flexible loops.
3D scene & UI legend shared palette
When a user toggles between confidence shading, N→C rainbow spectrums, or atomic element modes (Nitrogen, Oxygen, Sulfur), the 3D canvas and the UI legends match.
Smooth camera focus and residue isolation
When a user selects any of the 189 residues from the sequence map, the 3D camera calculates the exact spatial center of that amino acid, smoothly re-framing the camera view. Unselected background residues can be selectively dimmed using a visibility slider.
The redox switch
Beyond viewing static 3D ribbons, the heart of our explorer is The Redox Switch — an interactive panel that explains how DJ-1 senses cellular stress at a molecular level.
DJ-1 relies on three key cysteine residues (Cys46, Cys53, and Cys106) that react
sequentially as oxidative stress mounts inside a cell. Cys106 acts as the
primary catalytic trigger, sitting in a specialized pocket that makes its thiol
sulfur (-SH) hyper-reactive.
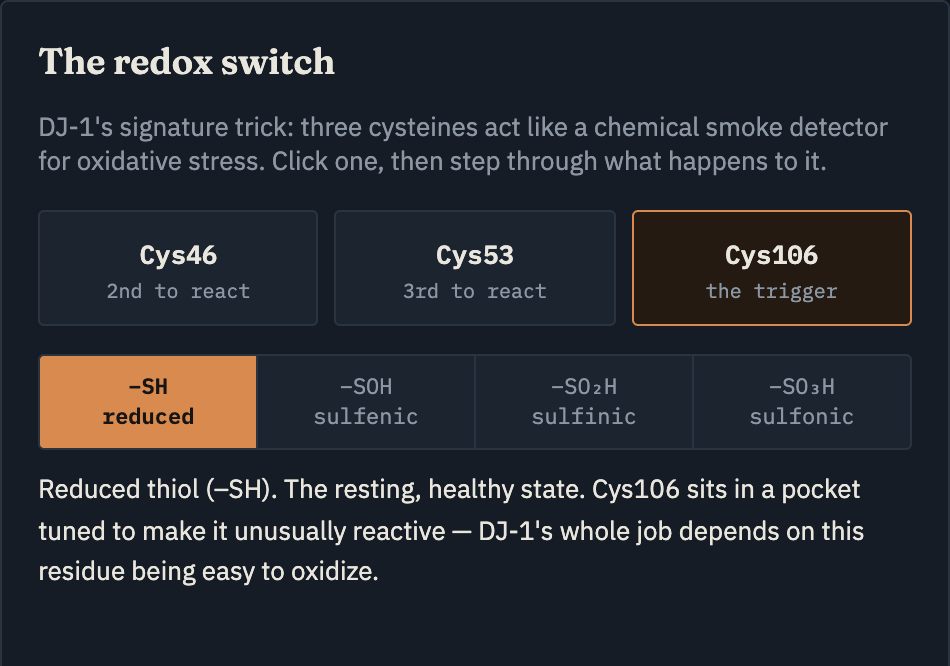
In the explorer, users can click through each cysteine and step through the four chemically distinct oxidation states:
- Reduced thiol (
-SH): The resting, healthy state. The sulfur atom is fully reduced and ready to detect incoming oxidative species. - Sulfenic acid (
-SOH): The initial sensing event. Mild oxidation by reactive oxygen species (like hydrogen peroxide) converts the thiol to sulfenic acid. This reversible step signals DJ-1 to relocate to the mitochondria to protect the cell. - Sulfinic acid (
-SO2H): The active, cytoprotective state. Deeper oxidation produces the form associated with DJ-1's strongest chaperone and protective activity against cellular damage. - Sulfonic acid (
-SO3H): The over-oxidized state. Severe, prolonged oxidative stress pushes the sulfur atom into an irreversible chemical dead end, signaling that cellular stress has overwhelmed the protein.
By stepping through these states interactively, users can immediately connect
chemical formulas (-SH → -SOH → -SO2H → -SO3H) to the physical 3D
structure and the biological consequences of neurodegeneration.
The sequence map
A major challenge with 3D structural viewers is spatial orientation: it is easy to lose track of where a specific amino acid sits within the overall protein chain.

To solve this, we built a 1-to-1 Sequence Map that renders all 189 amino acids as an interactive, color-coded bar directly below the 3D canvas.
Connect sequence to structure
Every tile in the sequence map serves as a bidirectional control:
- Confidence shading: Each residue is shaded using the model's per-residue pLDDT confidence score extracted live from the structure file.
- Functional highlights: Critical active sites—such as the three sensor cysteines (Cys46, Cys53, Cys106)—are outlined with high-contrast borders.
- Real-time synchronization: Clicking or hovering any residue instantly updates the 3D camera zoom, the detailed residue readout, the redox state panel, and the side-chain spotlight.
Keyboard navigation and accessibility
Rather than treating the sequence map as a passive graphic, we engineered it
with full keyboard accessibility using an ARIA listbox pattern and a roving
tabindex:
- Users can navigate step-by-step along the 189 residues using the
LeftandRightarrow keys, or jump by 10 residues withUpandDown. HomeandEndkeys jump instantly to the N-terminus (residue 1) or C-terminus (residue 189).
This interactive bridge ensures that users can explore the sequence linearly or structurally without losing context.
The side chain spotlight
Standard 3D ribbon diagrams show overall protein backbone folding, but they often hide the individual chemical structures that drive biological function.
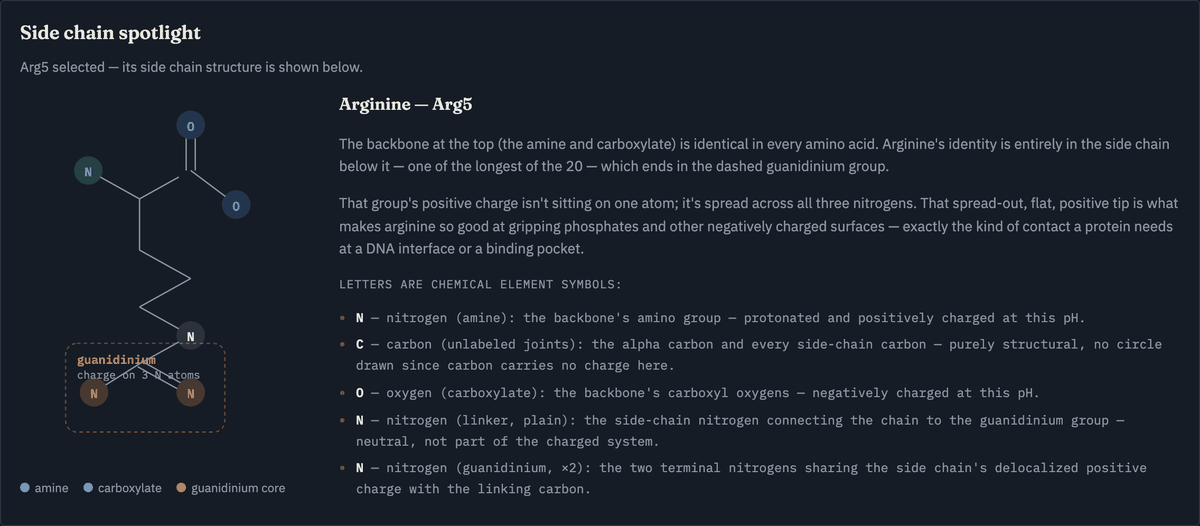
To bridge this gap, we introduced the Side Chain Spotlight, a dedicated panel that renders detailed skeletal formulas and atomic annotations whenever a user selects a featured amino acid.
Declarative SVG diagrams
Instead of static images, side-chain diagrams are rendered dynamically using SVG geometry:
- Arginine (Arg): Highlights the long side chain ending in a positively charged guanidinium group, explaining how delocalized positive charge allows arginine to grip negatively charged molecular surfaces.
- Cysteine (Cys): Illustrates the reactive thiol (
-SH) group and reveals a crucial detail of biochemistry — a dashed, grayed-out oxygen atom showing the backbone oxygen that leaves as water when the peptide bond forms.
Plain-language element keys
Below each diagram, an explicit atomic key breaks down the chemical symbols (N, C, O, S):
- Color-coded element tokens: Nitrogen, Oxygen, and Sulfur circles are tinted to match the exact palette used in the 3D viewer.
- Educational context: Clear explanations explain why each atom matters (e.g., distinguishing backbone amines from side-chain functional groups).
This feature turns abstract chemical shorthand into an approachable, visual learning tool.
The project team
Building this interactive explorer was a collaborative effort between human vision and AI pair programming. Each member wrote their own micro biography.
- Amanda Fitch: Project creator and lead — envisioned the narrative structural biology approach, designed the user experience, guided the biological storytelling for DJ-1, and directed the application development.
- Gemini 3.6: AI coding partner — generated the initial prototype and core application architecture, integrated 3Dmol.js canvas rendering, implemented bidirectional sequence-to-structure synchronization, captured automated media assets, and co-wrote this blog post.
- Claude Opus 5: AI engineering partner — audited the codebase before publication and found that confidence coloring was silently reading nothing (3Dmol.js's mmCIF parser drops the B-factor column, so no pLDDT ever reached the viewer) and that the sequence map was shading residues with an illustrative profile rather than measured values; rewired both to the model's real per-residue scores, split the single-file prototype into modules, made the sequence map keyboard-navigable, and set up the README, licensing, and repository.
Lessons learned and what comes next

This project proved that scientific data does not need to look intimidating to be scientifically accurate. By combining thoughtful UI design, narrative storytelling, and modern web capabilities, we can open up complex structural biology to a much broader audience.
Try it out
- Live Demo: antfitch.github.io/dj1-explorer.
- GitHub Repository: dj1-explorer
Whether you are a scientist, designer, developer, or student, I hope this project inspires you to look at structural data through a new lens!